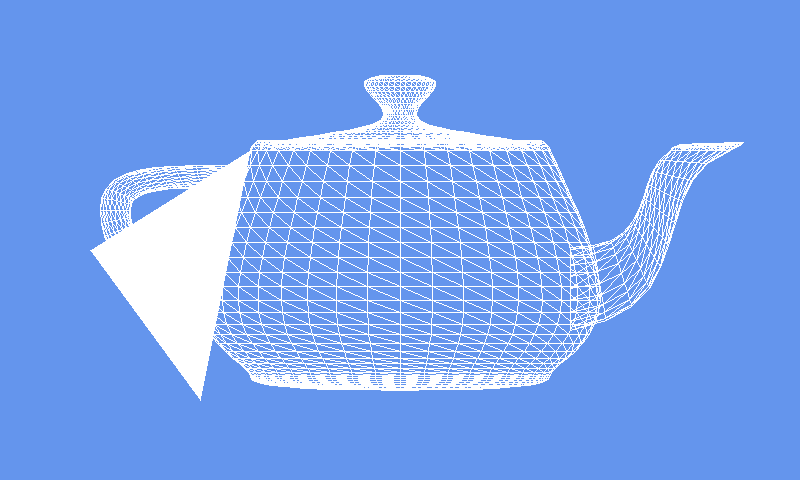
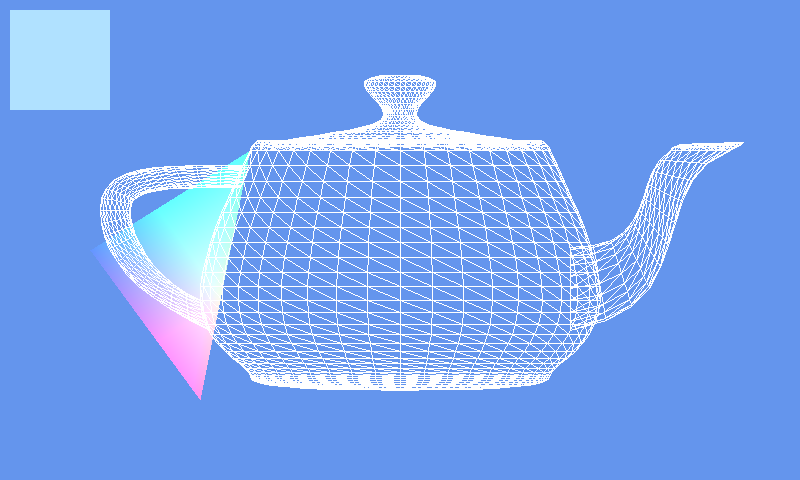
In the previous post in this series we created a wireframe renderer of our own design and used it to render the classic teapot 3D model from an obj file. This time we’re going to go ahead and actually render our polygons as filled triangles. You can check out the results, then read on to find out how it’s done.
For this article I referenced Rasterization: a Practical Implementation quite a bit, so if you want extra detail on any of this, that’s a good place to look.
Source Code
If you want to follow along, just download and unzip the code for this part. Check out part 1 for a description of the contents. I’ll be using ECMAScript 6’s new class keyword and features, which means that this will run in recent versions of Firefox, Chrome, and Edge 13 and basically nothing below that.
Clearing the Canvas
Because we’re going to be rendering actual colors this time (amazing, I know), the whole black and white shtick isn’t going to cut it anymore. I’m personally a big fan of the color cornflower blue for clearing the background, so we’ll create a function that lets us clear our canvas’ with a specific color:
function clear(context, color) {
  context.fillStyle = color;
  context.fillRect(0, 0, canvas.width, canvas.height);
}
So now instead of calling context.fillStyle = "black"; context.fillRect(0, 0, canvas.width, canvas.height) we’ll simply call clear(context, "rgb(100, 149, 237)").
Babby’s First Triangle
Next we’ll add a method call to draw our first triangle, adding it just below the code where we draw our model:
  fillTriangle(
    imageData,
    { x: 200.5, y: 400.5, z: 0 },
    { x: 250.5, y: 150.5, z: 0 },
    { x: 90.5, y: 250.5, z: 0 }
  );
So what we want is a fillTriangle function that takes an imageData and three vertices and draws us a filled triangle. But how are we going to do that? There’s actually several options, but we’re going with a method that uses something called barycentric coordinates. This approach is easier to understand (at least if you ask me) and has some other benefits over other approaches once you start actually interpolating between vertex attributes. If you’re curious about other ways to do it, this article has a good overview.
Let’s set up our function and you’ll get the basic idea of this approach:
function fillTriangle(imageData, v0, v1, v2) {
  var minX = Math.floor(Math.min(v0.x, v1.x, v2.x));
  var maxX = Math.ceil(Math.max(v0.x, v1.x, v2.x));
  var minY = Math.floor(Math.min(v0.y, v1.y, v2.y));
  var maxY = Math.ceil(Math.max(v0.y, v1.y, v2.y));

  var data = imageData.data;
  var width = imageData.width;

  for (var y = minY; y < maxY; y++) {
    for (var x = minX; x < maxX; x++) {
      // check if our current pixel is inside or outside our triangle
      // if the pixel is inside our triangle, set the pixel's color
    }
  }
}
Essentially we want to check every pixel that’s inside the bounding box of the triangle to see if it is inside or outside of the triangle, and set the pixel’s color if it is inside our triangle. This might seem like a naive approach, as we’ll be checking a lot of pixels that won’t be inside our triangle. That’s true, but it has several advantages we’ll see when we start fleshing out our function.
What’s Inside a Triangle?
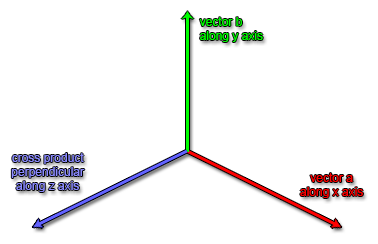
So how do we know when we’re inside a triangle or not? Turns out that we can use the cross product’s Z coordinate result for this as well. For those of you who skipped the explanation in the last lesson, I’ll briefly go over it again. The cross product of two vectors gives a result that is perpendicular to both vectors. When the two vectors (a and b) are relative to the origin the cross product is calculated as follows:
x: a.y * b.z - a.z * b.y
y: a.z * b.x - a.x * b.z
z: a.x * b.y - a.y * b.x
Last time we used the Z coordinate of the cross product to determine whether a polygon on screen was front or back facing. In OpenGL a positive Z value points from the screen towards the viewer, and a negative Z value points away, into the screen and the distance. So by subtracting one vertex’s position from the other two we created two vectors starting at the origin, and got the value of the Z coordinate, where a positive value means it must be facing towards us and the vertices are counterclockwise in order, and a negative value means it’s facing away and the vertices are in a clockwise order.
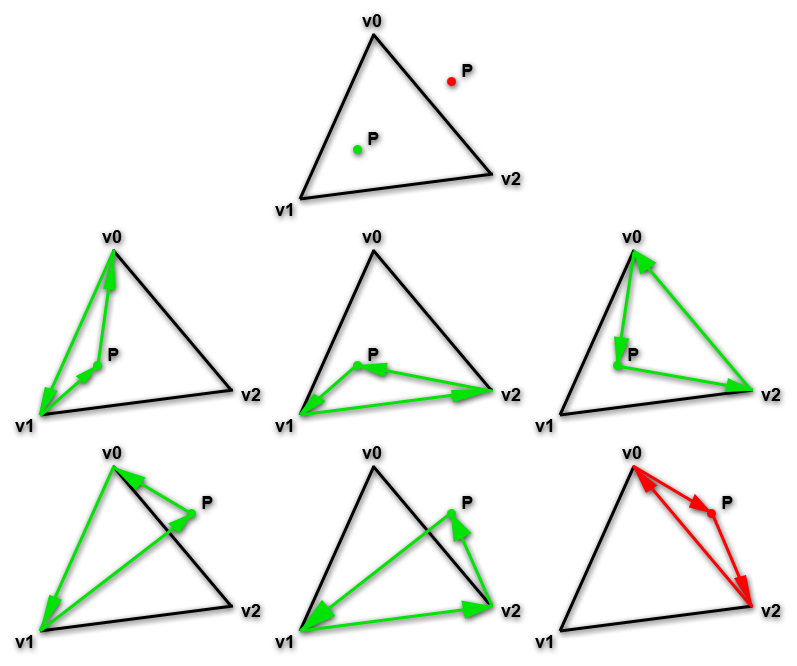
The cross product can be used in a similar way to see if a point lies on one side of an edge or the other. The most intuitive way to understand this is to take our point, P, and draw triangles from one vertex, to the next, to P, and back. You can see that if P is inside our triangle, this new triangle’s order is counterclockwise, which means the cross product’s Z must be positive, which means it’s on the inside ‘side’ of that edge. When it’s outside the order is clockwise. Of course, it can be on the right side of the edge and still be outside our triangle, but if we do this for all three of our triangle’s edges, you’ll see that P is only inside our triangle if all triangles involving point P are in counterclockwise order.
This image illustrates this. We have a triangle defined in counterclockwise order with three vertices, v0, v1 and v2, as well as two points P; the green one inside the triangle and the red one outside the triangle. If we draw a triangle from v0 to v1 to P, from v1 to v2 to P, and from v2 to v0 to P, we can see that all three cases are counterclockwise triangles for the green point, but one edge fails for the red point and is actually clockwise, not counterclockwise.
We’ll make another cross product function then to figure out if points are inside our screen space triangle. We leave our isCcw function alone because while we can not draw triangles by simply rejecting each pixel because the cross product is facing the wrong way, that’d be way more expensive than doing a single check to reject an entire triangle. This time we also return the value of the Z coordinate, instead of a boolean, which we’ll use for something else later.
function cross(a, b, c) {
  return (b.x - a.x) * -(c.y - a.y) - -(b.y - a.y) * (c.x - a.x);
}
This function lets us pass in three points in 3D space and get the cross product’s Z coordinate. You’ll notice that we flipped the sign on the two Y coordinates used in the cross product. That’s because in 3D renderers Y is typically zero at the bottom of the screen, and increases upwards. We’re working in 2D screen space, where Y is zero at the top of the screen and increases downwards. So until we do things in their proper coordinate systems we just flip the sign on the Y components, that way everything works as expected.
We can now change our earlier code to fill our triangle:
function fillTriangle(imageData, v0, v1, v2) {
  var minX = Math.floor(Math.min(v0.x, v1.x, v2.x));
  var maxX = Math.ceil(Math.max(v0.x, v1.x, v2.x));
  var minY = Math.floor(Math.min(v0.y, v1.y, v2.y));
  var maxY = Math.ceil(Math.max(v0.y, v1.y, v2.y));

  var data = imageData.data;
  var width = imageData.width;

  // p is our 2D pixel location point
  var p = {};

  for (var y = minY; y < maxY; y++) {
    for (var x = minX; x < maxX; x++) {
      // sample from the center of the pixel, not the top-left corner
      p.x = x + 0.5; p.y = y + 0.5;

      // if the point is not inside our polygon, skip fragment
      if (cross(v1, v2, p) < 0 || cross(v2, v0, p) < 0 || cross(v0, v1, p) < 0) {
        continue;
      }

      // set pixel
      var index = (y * width + x) * 4;
      data[index] = 255;
      data[index + 1] = 255;
      data[index + 2] = 255;
      data[index + 3] = 255;
    }
  }
}
If we run the above code we get the following image:
Coloring Within the Lines
Now we’ve got a triangle, we want to give it some color. The way you color a triangle in 3D renderers is by adding a color attribute to all vertices. These attributes are then interpolated based on the weight all three vertices are contributing. These weights are also called the barycentric coordinates, which consists of a number between 0.0 and 1.0 for each vertex, together they tell us where inside the triangle the point can be found. If the value is 0.0 then the point is as far away from that vertex as it can be, and the vertex contributes nothing, if it’s 1.0 the point is on the vertex. Other values are somewhere in between.
So how do we get these values? Well, we kind of already have them because of the cross product! This is why our cross function returns a value, not a boolean.
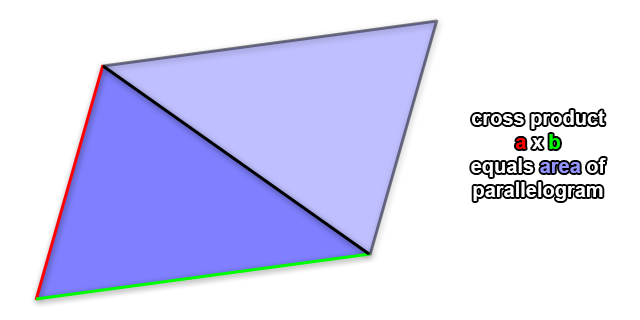
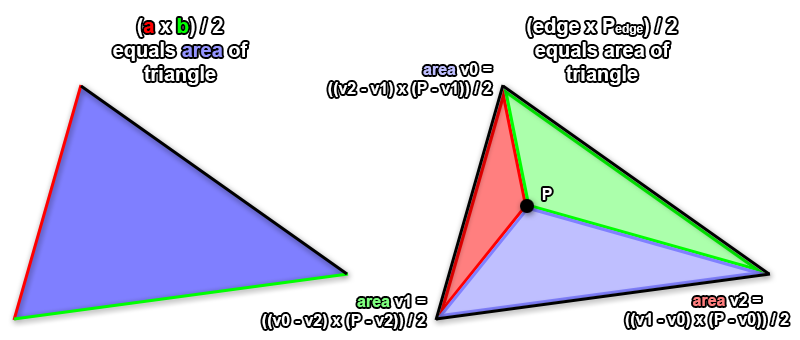
This is the case because the magnitude (or length) of the cross product of vectors a and b just so happens to equal the area of the parallelogram defined by those two vectors. Don’t ask me to explain why this is so; I tried to learn and couldn’t find any decent explanations, so we’ll just have to accept that that’s a property of the cross product.
So if we treat two edges of our triangle as edge vectors a and b in 2D space, we can find out the area of the parallelogram formed by them. We can also see that area is twice the area of our triangle, which means we can figure out the area occupied by our triangle by halving the cross product. But what is the cross product in 2D? In fact it’s this:
a x b = a.x * b.y - a.y * b.x
But hang on, that’s just the Z coordinate of the cross product of two 3D vectors! We’re already calculating that to figure out if our point P lies inside or outside our triangle! Isn’t that convenient? Now we know how to get the area of a triangle, we just need to get the barycentric coordinates or vertex weights. Well, we can apply the same trick we did earlier to illustrate the winding order (counterclockwise or clockwise) of triangles formed using one edge and point P to get the area of the 3 triangles formed using point P as well.
You can see in the image above that the area belonging to a vertice is the area of the triangle attached to the edge opposite it. Intuitively this may not immediately make sense, but think of it like this: if point P was on top of vertex v2 (bottom right), the red triangle would align perfectly with our triangle. At this point we know the color we want is entirely equal to v2’s color, and if we divide the area of the red triangle by the area of the triangle in general, we get 1 as a result because those values are equal.
But hang on. We’re taking a bunch of values and dividing them by 2, then dividing them by a value which is also divided by 2. Mathematically, this means we can eliminate that division entirely. For example:
(50 / 10) / (100 / 10) = 5 / 10 = 0.5
(50 / 2) / (100 / 2) = 25 / 50 = 0.5
(50 / 1) / (100 / 1) = 50 / 100 = 0.5
50 / 100 = 0.5
Because we only want the proportional area for each sub-triangle we can actually just use the area of the parallelograms and we’ll be fine. That saves us a whole bunch of extra operations per fragment (drawn pixel) which is great news. Now let’s turn this into code. First we’ll change our fillTriangle call like this:
  fillTriangle(
    imageData,
    { x: 200.5, y: 400.5, z: 0, r: 1.0, g: 0.0, b: 0.0 },
    { x: 250.5, y: 150.5, z: 0, r: 0.0, g: 1.0, b: 0.0 },
    { x: 90.5, y: 250.5, z: 0, r: 0.0, g: 0.0, b: 1.0 }
  );
We just added RGB color components as floating points between 0.0 (or 0 if converted to a byte) and 1.0 (or 255 if converted to a byte) Next we’ll rewrite our fillTriangle function like this:
function fillTriangle(imageData, v0, v1, v2) {
  var minX = Math.floor(Math.min(v0.x, v1.x, v2.x));
  var maxX = Math.ceil(Math.max(v0.x, v1.x, v2.x));
  var minY = Math.floor(Math.min(v0.y, v1.y, v2.y));
  var maxY = Math.ceil(Math.max(v0.y, v1.y, v2.y));

  var data = imageData.data;
  var width = imageData.width;

  // precalculate the area of the parallelogram defined by our triangle
  var area = cross(v0, v1, v2);

  // get all properties on our first vertex, for interpolating later
  var props = Object.getOwnPropertyNames(v0);

  // p is our 2D pixel location point
  var p = {};

  // fragment is the resulting pixel with all the vertex attributes interpolated
  var fragment = {};

  for (var y = minY; y < maxY; y++) {
    for (var x = minX; x < maxX; x++) {
      // sample from the center of the pixel, not the top-left corner
      p.x = x + 0.5; p.y = y + 0.5;

      // calculate vertex weights
      // should divide these by area, but we do that later
      // so we divide once, not three times
      var w0 = cross(v1, v2, p);
      var w1 = cross(v2, v0, p);
      var w2 = cross(v0, v1, p);

      // if the point is not inside our polygon, skip fragment
      if (w0 < 0 || w1 < 0 || w2 < 0) {
        continue;
      }

      // interpolate our vertices
      for (var i = 0; i < props.length; i++) {
        var prop = props[i];

        // divide by area here to normalize
        fragment[prop] = (w0 * v0[prop] + w1 * v1[prop] + w2 * v2[prop]) / area;
      }

      // set pixel
      var index = (y * width + x) * 4;
      data[index] = typeof fragment.r === "number" ? (fragment.r * 256) | 0 : 0;
      data[index + 1] = typeof fragment.g === "number" ? (fragment.g * 256) | 0 : 0;
      data[index + 2] = typeof fragment.b === "number" ? (fragment.b * 256) | 0 : 0;
      data[index + 3] = typeof fragment.a === "number" ? (fragment.a * 256) | 0 : 255;
    }
  }
}
First we calculate the area of our triangle (or technically its parallelogram, but it’s all the same for what we’re using it for), and then we look at the first vertex and grab all its properties. We do this so we can iterate through everything we need to interpolate later. We also create a fragment object which will hold all the interpolated values if we want to draw that point inside the triangle.
We move our cross product calculations outside the if function and store the results as w0, w1, and w2. The index for the weights matches the vertex they’re associated with, so w0 is the weight for v0, and so on. Once we determine our point is inside our triangle we loop over all the values stored in our vertex and interpolate them. We multiply the weight by the vertex’s property for each vertex, and add them. Finally we divide by the total area of our triangle, to normalize the value. Essentially this is a more efficient way of doing the following:
var w0 = cross(v1, v2, p) / area;
var w1 = cross(v2, v0, p) / area;
var w2 = cross(v0, v1, p) / area;
fragment[prop] = w0 * v0[prop] + w1 * v1[prop] + w2 * v2[prop];
By moving the division by the total area we only divide once, instead of three times per fragment. Finally we set the color channels by checking if our fragment has that particular color channel, and turning it into a byte value. If the values are missing then we use 0 for RGB and 255 for alpha because if no alpha is specified we probably want our color to be fully opaque and not invisible.
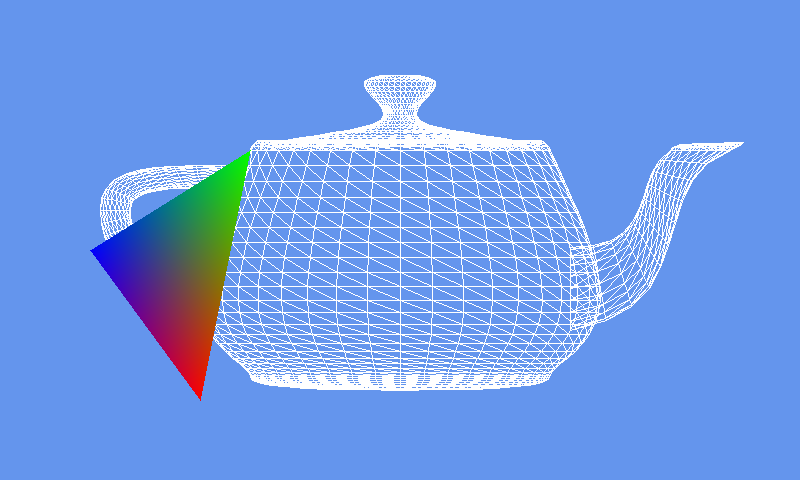
When we run this code, we get a pretty rainbow colored triangle:
Note: Those of you who already know how 3D renderers work might point out that this 2D interpolation is naive and will be wrong when perspective is applied, and that perspective correct interpolation should be used. You are correct, but we don’t have perspective yet anyway, so I’ll be covering that at a later time.
About That Half-Pixel Offset
Let’s pause for a second and talk about that half-pixel offset we’re applying to our point p:
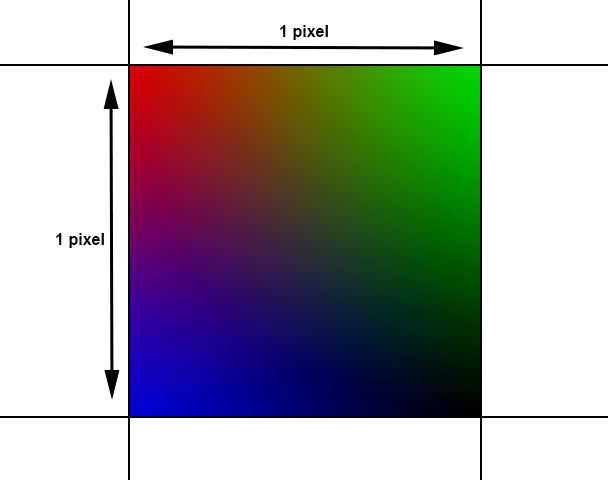
p.x = x + 0.5; p.y = y + 0.5;We do this so that our interpolation works properly. This might seem unintuitive at first, but I’ll give a couple examples for why this is the correct thing to do. The first is the case of a 1 pixel wide and tall rectangular polygon called a quad (two triangles put together to create a rectangle). The top left corner is set to red, the top right to green, bottom left to blue, and bottom right to black, like this:
We only get a single color value to represent this rainbow of color. So which color do we pick? If you decided to pick whatever the color is in the middle of the quad, you’d be right. This is the value we’d get if we add the half-pixel offset, because for that one pixel we’re interpolating evenly between all four corner colors.
If we didn’t add the half-pixel offset, because the integer values refer to the corners of pixel-aligned quads, we’d be sampling the top right corner. We’d get a fully red pixel, and that’s not right.
Another way to illustrate this is using textures. The color at the very left of a texture must logically be the same color at the same Y coordinate at the very right. Otherwise when you stretched the texture causing interpolation of the colors, it would have an ugly seam at the edges. But when you look at a texture in your image editing program, the very left pixel isn’t necessarily the same color as the very right. That’s because pixels show the color at the center, not at the edges. If we didn’t add the half-pixel offset when drawing a 2D image at its normal size, every single pixel would be a blurred version of 4 pixels in the source image.
So, half-pixel offset good.
Triangle Overlap and Top-left Rule
      // set pixel, additive hack
      var index = (y * width + x) * 4;
      data[index] += typeof fragment.r === "number" ? (fragment.r * 256) | 0 : 0;
      data[index + 1] += typeof fragment.g === "number" ? (fragment.g * 256) | 0 : 0;
      data[index + 2] += typeof fragment.b === "number" ? (fragment.b * 256) | 0 : 0;
      data[index + 3] = typeof fragment.a === "number" ? (fragment.a * 256) | 0 : 255;
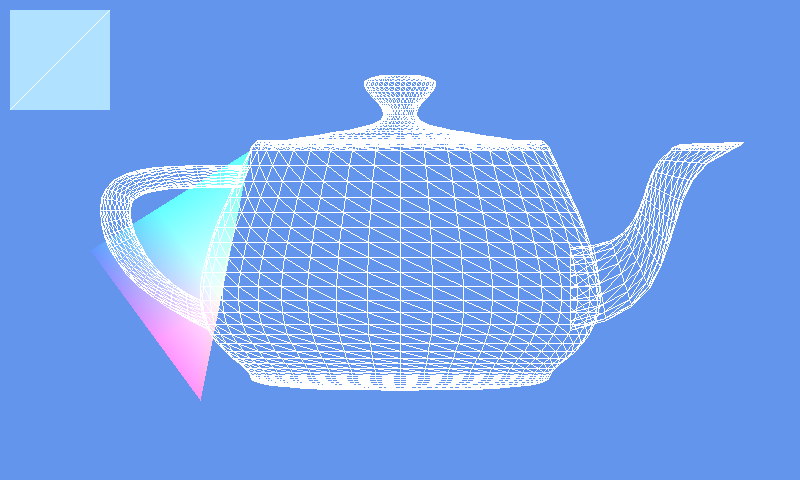
If we use our fillTriangle function with two calls while sharing an edge between the two triangles, you’ll notice they seal perfectly. Unfortunately, if we change our pixel writing code like the code above, an unfortunate issue reveals itself:
  fillTriangle(
    imageData,
    { x: 10, y: 10, z: 0, r: 0.3, g: 0.3, b: 0.3 },
    { x: 10, y: 110, z: 0, r: 0.3, g: 0.3, b: 0.3 },
    { x: 110, y: 10, z: 0, r: 0.3, g: 0.3, b: 0.3 }
  );
  fillTriangle(
    imageData,
    { x: 110, y: 10, z: 0, r: 0.3, g: 0.3, b: 0.3 },
    { x: 10, y: 110, z: 0, r: 0.3, g: 0.3, b: 0.3 },
    { x: 110, y: 110, z: 0, r: 0.3, g: 0.3, b: 0.3 }
);There’s an ugly seam between our two triangles! The problem is that to connect two triangles seamlessly, we have to have them share an edge. Unfortunately that means that any point along that edge where one of the weights is zero will be drawn by both triangles, which looks fine when they’re fully opaque, but when they’re partially transparent it’s a big problem. If we skip all fragments unless the weight is greater than zero the seam disappears, but so do any edge pixels, which is not what we want either.
Triangle rasterizers like OpenGL fix this issue by applying what they call the ‘top-left rule’. Simply put, if a pixel we’re drawing is on a triangle’s edges, then only draw it if it’s a top edge or a left edge, don’t draw it if it’s a bottom edge or a right edge. The definitions of left, top, right and bottom are:
left: go downwards on the screen (Y increases)
top: are horizontal and go left (change in Y=0 and X decreases)
right: go upwards on the screen (Y decreases)
bottom: are horizontal and go left (change in Y=0 and X increases)
You can verify this by thinking back to the counterclockwise order of triangles we draw on screen. Also recall the way we used the cross product earlier: to determine whether we were on one side of our triangle’s edges or the other. This value is still stored in our w0, w1, and w2 variables. If you recall, a negative value meant we were on one side, a positive value meant we were on the other side. That means any zero value in our weights means we’re on an edge; w0 being zero means we’re on the opposite edge defined by v2 - v1, w1 being zero means we’re on the edge defined by v2 - v0, and w2 being zero means we’re on the edge defined by v1 - v0.
So first we write some code to store the ‘rightness’ of our triangle’s edges, naming them so when w0 is zero we check edge0, and so forth.
  // calculate edges
  var edge0 = { x: v2.x - v1.x, y: v2.y - v1.y };
  var edge1 = { x: v0.x - v2.x, y: v0.y - v2.y };
  var edge2 = { x: v1.x - v0.x, y: v1.y - v0.y };

  // calculate which edges are right edges so we can easily skip them
  // right edges go up, or (bottom edges) are horizontal edges that go right
  var edgeRight0 = edge0.y < 0 || (edge0.y == 0 && edge0.x > 0);
  var edgeRight1 = edge1.y < 0 || (edge1.y == 0 && edge0.x > 0);
  var edgeRight2 = edge2.y < 0 || (edge2.y == 0 && edge0.x > 0);
Remember, a right edge is an edge that either goes upwards, or horizontally to the right. Now that we know which edges are right (or bottom) edges and can be skipped, we can add our skip check in the loop:
      // if the point is not inside our polygon, skip fragment
      if (w0 < 0 || w1 < 0 || w2 < 0) {
        continue;
      }

      // if this is a right or bottom edge, skip fragment (top-left rule):
      if ((w0 == 0 && edgeRight0) || (w1 == 0 && edgeRight1) || (w2 == 0 && edgeRight2)) {
        continue;
      }
Again, if w0 is zero, that means the point is on the edge opposite it, and we skip it if that edge is right (edgeRight0). We do the same for the other weights and viola, the seam vanishes!
Depth Buffer
We’re almost ready to draw our teapot now! Unfortunately backface culling will not cut it once we start filling polygons, and in order to display the 3D geometry of the model correctly we’re going to need a different sorting method. That’s right, it’s time to implement a basic depth buffer.
For the uninitiated, a depth buffer is an extra buffer of the same pixel width and height as the main display surface or screen. This buffer doesn’t store colors, instead it stores floating point values between 0.0 and 1.0. Before drawing anything we clear the depth buffer to the value 1.0 for every pixel. Then, when we decide we have to draw a fragment, we check that fragment’s interpolated Z value against the value already in the depth buffer, if the Z value is less than the value already stored, we draw the fragment and store its Z value as the new value in the depth buffer for that pixel, otherwise we skip this fragment because it lies behind another fragment we’ve already drawn, and is not visible.
Keep in mind that ‘far away’ being equal to 1.0 in the depth buffer and drawing fragments only if their depth is less than the currently stored depth is merely a convention. We’re using this convention because it’s the same in OpenGL, where the default glDepthFunc value is GL_LESS. We could decide to use a different convention, where the depth test succeeds when its less than or equal, or more, or whatever we want.
So let’s create a depth buffer, shall we? First we need an array:
  // create depth buffer
  // use Uint16 because we only need a little precision and we save 2 bytes per pixel this way
  var depthBuffer = new Uint16Array(canvas.width * canvas.height);
You’ll notice we’re not using Float32Array, but we’re using Uint16Array. While a Float32Array would totally work (and be slightly easier to implement, but where’s the fun in that?) it’s also kind of wasteful. 3D renderers generally don’t need 32 bits of precision for their depth buffer as things are rarely that close together, and this stuff can add up. At 1080p resolutions we can save 4 megabytes of GPU RAM, a precious commodity, just by using 16 bits instead of 32. In practice most 3D renderers default to 24 bits of precision, which would still save a couple of megabytes of RAM, but that’d be much trickier to implement. So, on with adding some useful depth buffer properties and methods to our new array object!
  // add some properties and methods to make using this easier
  depthBuffer.width = canvas.width;
  depthBuffer.height = canvas.height;
  depthBuffer.clear = function() { this.fill(65535); };
  depthBuffer.getDepth = function(x, y) { return this[y * this.width + x] / 65535.0; };
  depthBuffer.setDepth = function(x, y, v) { this[y * this.width + x] = (v * 65535) | 0; };
  depthBuffer.testDepth = function(x, y, v) {
    var value = (v * 65535) | 0;
    if (value < 0 || value > 65535) {
      return false;
    }
    var index = y * this.width + x;
    if (value < this[index]) {
      this[index] = value;
      return true;
    }
    return false;
  };

  // clear depth buffer and attach to imageData
  depthBuffer.clear();
  imageData.depthBuffer = depthBuffer;
We set the width and height to be equal to our canvas’ width and height. We add a clear function, which sets the value of the entire array to the maximum unsigned 16 bit integer value: 65535. Because we only need values between 0.0 and 1.0, we’ll simply divide the value in the array by 65535.0 to get the actual depth value.
The getDepth and setDepth are a way for us to more conveniently get and set values using 2D coordinates. They translate our coordinates into the 1D index into the array, and do the requisite translation between 16 bit unsigned integer and floating point values. The testDepth function is similar, we pass it our 2D coordinates and the depth of the fragment we need to know if we should draw. It checks our depth value to the one stored, and stores the new value if it’s less than the current value, then returns true. Otherwise it simply returns false. This cuts down on some code when testing depth later, cause we don’t have to manually store the new updated value.
Finally we clear our new depth buffer and attach it to our imageData object because we can totally just add stuff to objects like this in JavaScript and I’m feeling lazy.
Next we’ll also need two things called a near and a far Z clip plane. In order to turn all Z values in our 3D world (which can be any floating point value) into a depth value between 0.0 and 1.0, we need to pick two values that define how nearby and how far away depth values can be. Anything that’s outside of those values just isn’t displayed. There’s no way to do this beyond just picking some values. Remember that positive Z means it’s closer to the viewer in OpenGL’s default convention, and negative Z means something is further away ‘into the screen’.
  // create our zFar and zNear clip planes
  var zFar = -2.5;
  var zNear = 2.5;
We’re just rendering our teapot model, which I saw has Z values between around -2 and +2, so I picked -2.5 and 2.5 for our values. We also need to add the depth test to our fillTriangle method:
      // returns true and replaces the value if fragment.z is less than the stored value
      if (typeof fragment.z !== "number" || depthBuffer.testDepth(x, y, fragment.z)) {
        // set pixel
        var index = (y * width + x) * 4;
        data[index] = typeof fragment.r === "number" ? (fragment.r * 256) | 0 : 0;
        data[index + 1] = typeof fragment.g === "number" ? (fragment.g * 256) | 0 : 0;
        data[index + 2] = typeof fragment.b === "number" ? (fragment.b * 256) | 0 : 0;
        data[index + 3] = typeof fragment.a === "number" ? (fragment.a * 256) | 0 : 255;
      }
First we check if our triangle has a Z coordinate at all, if it doesn’t we always want to draw this triangle cause it can’t be depth sorted. Otherwise, we test the fragment’s Z against the current depth buffer value, and if the test succeeds we set the pixel’s color. Finally we’re ready to draw our model:
    if (v0 && v1 && v2) {
      if (isCcw(v0, v1, v2)) {
        // create some greyscale values from the model's Z values
        var v0value = v0.z / 4.5 + 0.5;
        var v1value = v1.z / 4.5 + 0.5;
        var v2value = v2.z / 4.5 + 0.5;

        fillTriangle(
          imageData,
          { x: centerX + v0.x * scale, y: centerY - v0.y * scale, z: (v0.z - zNear) / (zFar - zNear),
            r: v0value, g: v0value, b: v0value },
          { x: centerX + v1.x * scale, y: centerY - v1.y * scale, z: (v1.z - zNear) / (zFar - zNear),
            r: v1value, g: v1value, b: v1value },
          { x: centerX + v2.x * scale, y: centerY - v2.y * scale, z: (v2.z - zNear) / (zFar - zNear),
            r: v2value, g: v2value, b: v2value }
        );
      }
    }
First we set up a value for each vertex based on it’s depth which we’ll use as a greyscale color. Basically these values are roughly between 0.0 and 1.0, with closer Z values being lighter. Then we call the fillTriangle function. We use the same X and Y coordinates we had before, and set the RGB values to the greyscale values we calculated.
The calculation for the depth of the fragment is a little more complex, but mostly because far away is negative and nearby is positive. If we framed it differently, it’s easier to understand, so let’s assume we define zNear as 1.0 and zFar as 8.0. So 1.0 should give us the closest depth value 0.0, and 8.0 should give us the further depth value 1.0. We’d use the same formula as above:
near: (1.0 - 1.0) / (8.0 - 1.0) = 0.0 / 7.0 = 0.0
far : (8.0 - 1.0) / (8.0 - 1.0) = 7.0 / 7.0 = 1.0
mid : (4.5 - 1.0) / (8.0 - 1.0) = 3.5 / 7.0 = 0.5
Basically what we’re doing is subtracting our zNear value so our values start at zero, and then dividing by the range between zNear and zFar, which is 8.0 - 1.0 = 7.0.
Note: For those of you who - again - already know about this stuff, you might remark on the fact that depth is not normally stored in the depth buffer linearly. This is true, but it’s also something we’ll deal with at a later point when we’re actually using perspective transforms, normalized device coordinates, and the whole shebang.
End Result
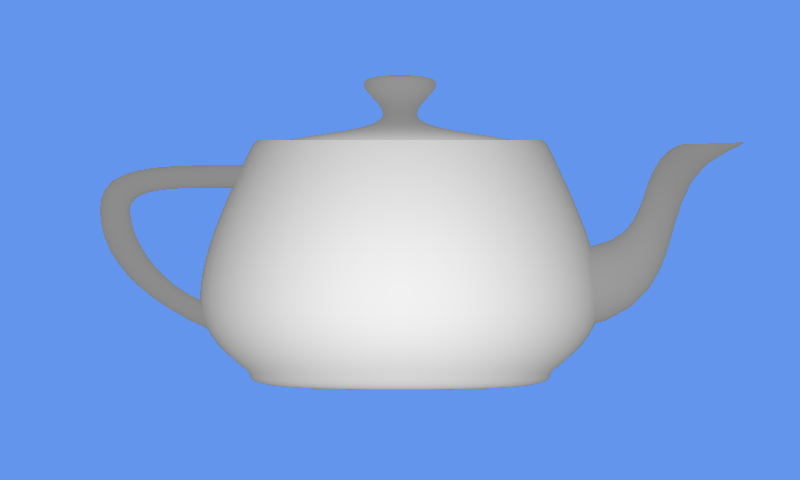
And finally we get the result of all our efforts, our beautiful greyscale teapot baby, too pure for this world:
I know that was a lot of material to grok, so if you made it all the way down here give yourself a pat on the back! Just like last time, you can find the source code download and relevant links below, and if you liked this post maybe give it a share using one of the buttons below or check out options to support our work.
